Wireshark is a powerful network analyzer that can be used to analyze the traffic passing through your computer's network interface. You may need it to detect and solve network problems, debug your web applications, network programs or sites. Wireshark allows you to fully view the contents of a packet at all levels, so you can better understand how the network works at a low level.
All packets are captured in real time and provided in an easy-to-read format. The program supports a very powerful filtering system, color highlighting, and other features that will help you find the right packages. In this tutorial, we'll look at how to use Wireshark to analyze traffic. Recently, the developers began working on the second branch of the Wireshark 2.0 program, many changes and improvements were made to it, especially for the interface. This is what we will use in this article.
Before moving on to considering ways to analyze traffic, you need to consider what features the program supports in more detail, what protocols it can work with and what it can do. Here are the main features of the program:
- Capture packets in real time from wired or any other type of network interfaces, as well as read from a file;
- The following capture interfaces are supported: Ethernet, IEEE 802.11, PPP and local virtual interfaces;
- Packets can be filtered based on many parameters using filters;
- All known protocols are highlighted in the list in different colors, for example TCP, HTTP, FTP, DNS, ICMP and so on;
- Support for capturing VoIP call traffic;
- Decryption of HTTPS traffic is supported if a certificate is available;
- Decryption of WEP and WPA traffic of wireless networks with a key and handshake;
- Displaying network load statistics;
- View package contents for all network layers;
- Displays the time of sending and receiving packages.
The program has many other features, but these were the main ones that might interest you.
How to use Wireshark
I assume that you already have the program installed, but if not, you can install it from the official repositories. To do this, type the command in Ubuntu:
sudo apt install wireshark
After installation, you can find the program in the main menu of the distribution. You need to run Wireshark with superuser rights, because otherwise it will not be able to analyze network packets. This can be done from the main menu or via the terminal using the command for KDE:
And for Gnome/Unity:
The main window of the program is divided into three parts: the first column contains a list of network interfaces available for analysis, the second - options for opening files, and the third - help.
Network traffic analysis
To start analysis, select a network interface, for example eth0, and click the button Start.

After this, the following window will open, already with a stream of packets that pass through the interface. This window is also divided into several parts:
- Top part- these are menus and panels with various buttons;
- List of packages- then the flow of network packets that you will analyze is displayed;
- Package Contents- just below is the contents of the selected package, it is divided into categories depending on the transport level;
- Real performance- at the very bottom the contents of the package are displayed in real form, as well as in HEX form.
You can click on any package to analyze its contents:

Here we see a DNS request packet to get the site's IP address, in the request itself the domain is sent, and in the response packet we receive our question as well as the answer.
For more convenient viewing, you can open the package in a new window by double-clicking on the entry:

Wireshark filters
Manually going through packages to find the ones you need is very inconvenient, especially with an active thread. Therefore, for this task it is better to use filters. There is a special line under the menu for entering filters. You can click Expression to open the filter designer, but there are a lot of them, so we’ll look at the most basic ones:
- ip.dst- target IP address;
- ip.src- sender's IP address;
- ip.addr- IP of the sender or recipient;
- ip.proto- protocol;
- tcp.dstport- port of destination;
- tcp.srcport- sender port;
- ip.ttl- TTL filter, determines the network distance;
- http.request_uri- the requested site address.
To specify the relationship between a field and a value in a filter, you can use the following operators:
- == - equals;
- != - not equal;
- < - less;
- > - more;
- <= - less or equal;
- >= - more or equal;
- matches- regular expression;
- contains- contains.
To combine multiple expressions you can use:
- && - both expressions must be true for the package;
- || - one of the expressions may be true.
Now let's take a closer look at several filters using examples and try to understand all the signs of relationships.
First, let's filter all packets sent to 194.67.215.. Type a string in the filter field and click Apply. For convenience, Wireshark filters can be saved using the button Save:
ip.dst == 194.67.215.125

And in order to receive not only sent packets, but also those received in response from this node, you can combine two conditions:
ip.dst == 194.67.215.125 || ip.src == 194.67.215.125


We can also select transferred large files:
http.content_length > 5000
By filtering the Content-Type, we can select all the pictures that have been uploaded; Let's analyze Wireshark traffic, packets that contain the word image:
http.content_type contains image
To clear the filter, you can press the button Clear. It happens that you do not always know all the information necessary for filtering, but just want to explore the network. You can add any field of a package as a column and view its contents in the general window for each package.
For example, I want to display the TTL (time to live) of a packet as a column. To do this, open the package information, find this field in the IP section. Then call the context menu and select the option Apply As Column:


In the same way, you can create a filter based on any desired field. Select it and bring up the context menu, then click Apply as filter or Prepare as filter, then select Selected to display only the selected values, or Not selected to remove them:

The specified field and its value will be applied or, in the second case, inserted into the filter field:

In this way, you can add a field of any package or column to the filter. There is also this option in the context menu. To filter protocols, you can use simpler conditions. For example, let's analyze Wireshark traffic for the HTTP and DNS protocols:
Another interesting feature of the program is the use of Wireshark to track a specific session between the user's computer and the server. To do this, open the context menu for the package and select Follow TCP stream.
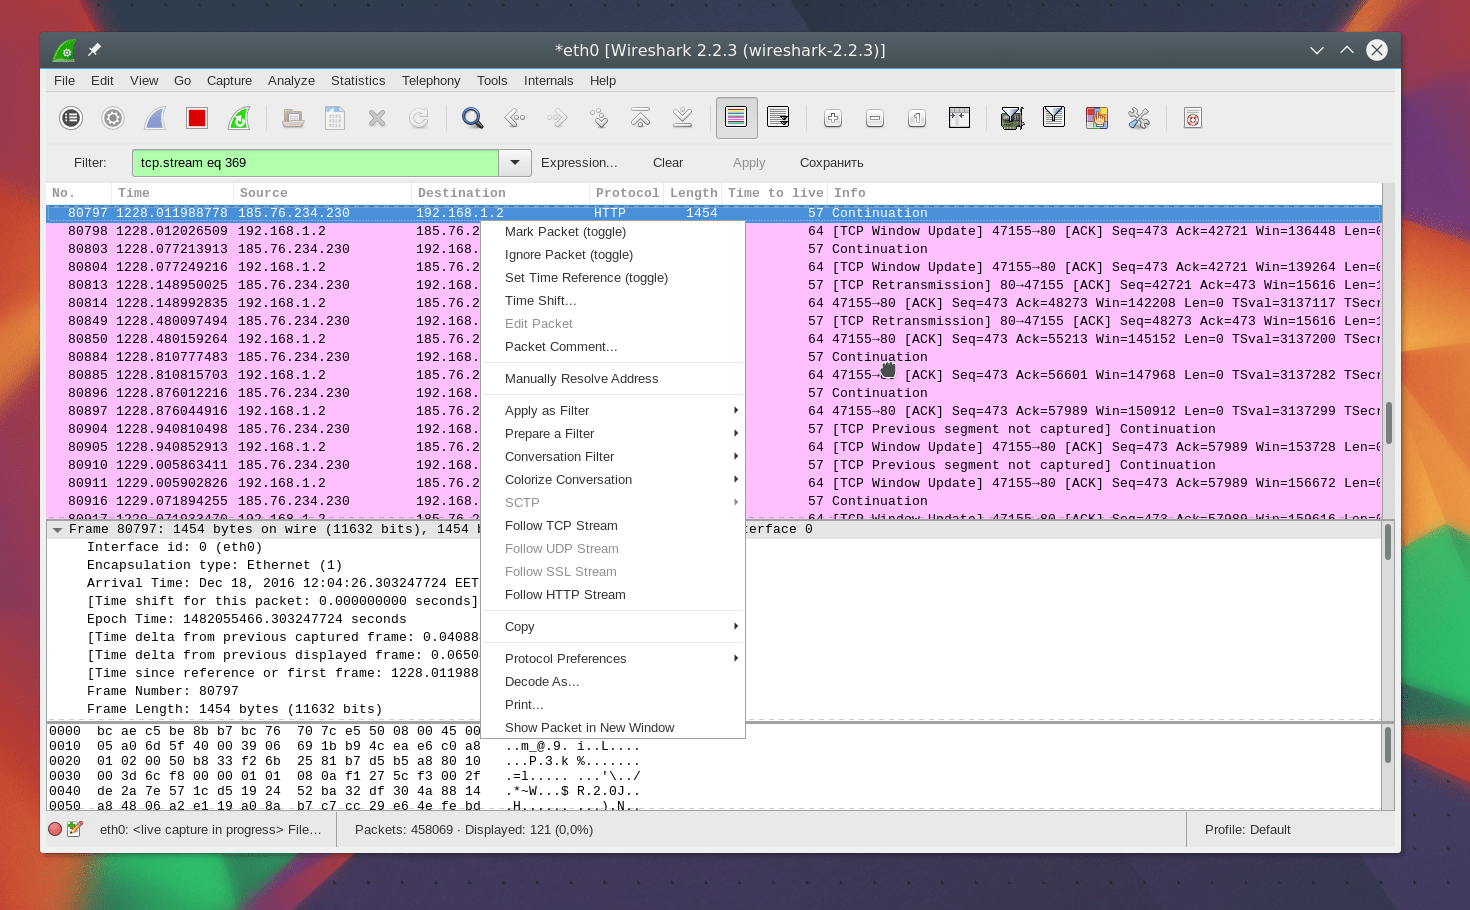
A window will then open in which you will find all the data transferred between the server and the client:

Diagnosing Wireshark problems
You may be wondering how to use Wireshark 2.0 to detect problems on your network. To do this, there is a round button in the lower left corner of the window; when you click on it, a window opens Expet Tools. In it, Wireshark collects all error messages and network problems:

The window is divided into tabs such as Errors, Warnings, Notices, Chats. The program can filter and find many network problems, and here you can see them very quickly. Wireshark filters are also supported here.

Wireshark traffic analysis
You can very easily understand what users downloaded and what files they viewed if the connection was not encrypted. The program does a very good job of extracting content.
To do this, you first need to stop traffic capture using the red square on the panel. Then open the menu File -> Export Objects -> HTTP:


Introduction
When studying network interactions at the level of individual packets, datagrams, segments, and application-level messages, it is often necessary to solve traffic filtering problems. The essence of using filters is to search and select groups, as well as individual transmission units that are of interest for further analysis. This functionality is extremely useful in tools designed to intercept and study network traffic (sniffers), and helps a system administrator or information security specialist find a bit of useful information in the intensive information flows of modern networks.
The open multiplatform software discussed in this article Wireshark protocol analyzer has two filter subsystems: time of traffic interception (capture filters) and display filters. As you know, the first subsystem is based on the rules language of the Pcap (Packet Capture) library. “Scrubbing” traffic during collection, in particular, reduces the number of packets intercepted, thereby saving space in memory or on the hard drive. As for display filters, they, being a built-in function of Wireshark, are designed to “customize” already intercepted traffic in the program’s graphical interface.
About filter languages
The ability to intercept traffic for monitoring and debugging purposes is present in the network stack of any operating system. It is carried out using the so-called Packet Filter, which is part of the system kernel and receives received/sent packets from the network card driver. The most famous packet filters for Unix-like operating systems are BPF (Berkeley Packet Filter) and LSF (Linux Socket Filter).
Thus, traffic sampling according to specified criteria in BPF implemented in the form of a special case-sensitive primitive machine language, for which the packet filter itself acts as an interpreter. Programs in this language can extract fragments from packets, compare the received data with specified values, test individual bits, perform arithmetic operations, and then accept or discard packets depending on the results of all these tests. The "low-level" approach is useful for programmers developing network function libraries and various utilities.
Ordinary users usually use "high-level" filter languages. A typical application language used in a sniffer to describe traffic rules allows the construction of expression primitives based on individual message fields of various protocols. In this case, the criterion can be the ratio of the field value to a certain value (equal to, greater than, less than), the coincidence of the value with the template, or simply the presence of the field in the message. Primitives can be combined into a complex expression using logical functions (“and”, “or”, “not”, etc.).
In the open source world, the de facto standard filter language is the syntax used in the Pcap library. It is the basis not only for Wireshark, but also for other open source utilities, such as, for example, the well-known console sniffer tcpdump in the Unix world. Actually, Pcap and tcpdump are a joint project. The popular intrusion detection system Snort also uses the Pcap format in packet capture mode to define traffic filtering rules.
Pcap Filter Basics
So, filter includes one or more primitives. A primitive usually consists of an object (number or name) and one or more specifiers specifying the protocol (ether, fddi, tr, wlan, ip, ip6, arp, rarp, decnet, tcp, udp), direction (src, dst, any and etc.) and object type (host, net, port, etc.). For example, to intercept packets in which the outgoing IP address is 192.168.56.102, you should use a filter like:
IP src host 192.168.56.102
Or to record ARP traffic involving hosts on the 192.168.56.0 network:
Arp net 192.168.56
Frequently used specifiers are summarized in a table (optional components are designated - , alternatives - |, objects -< >). A complete list can be found in the Pcap documentation (on Linux, available in the user manual using the man pcap-filter command).
In order to combine several primitives into one expression, logical functions are used: “and” (denoted by the keyword and or &&), “or” (or or ||), “not” (not or!). For example, to intercept SSH protocol traffic for node 192.168.56.102, the following design is suitable:
Tcp port 22 and host 192.168.56.102
For very complex expressions, parentheses should be used. For example:
Net 192.168.56.0/24 and (tcp port 21 or tcp port 22)
Pcap filters without restrictions
For those who are used to living by their own rules, the Pcap library provides random access to the contents of network packets, using the full power of the OS packet filter. This is done using a fairly simple syntax:
Proto[exp:size]
where, the proto parameter is one of the protocols supported by Wireshark; exp is the offset in bytes relative to the beginning of the layer specified in proto, and size is the number of bytes to extract.
Considering that in primitives it is possible to apply comparison operations in the notation of the C programming language (>, =,
The example, however, has only a methodological meaning, since this protocol is easily filtered by the standard icmp rule.
But selecting HTTP requests made using the GET method on the fly from traffic is not such an easy task for Pcap. And the solution proposed in the documentation claims to be original:
Port 80 and tcp[((tcp & 0xf0) >> 2):4] = 0x47455420
This filter checks for the presence of the "G", "E", "T" and "" bytes (hex values 47, 45, 54 and 20) immediately after the TCP header, the length of which is calculated by the expression "tcp & 0xf0) >> 2".
As can be seen from the last example, in addition to comparison operations, binary C operators (+, -, *, /, &, |, >) are also available to the user directly in the primitives.
About display filters
Speaking of differences display filters from Pcap filters, then in addition to the format for recording specifiers (protocol fields look like..., for example ip.len), you can also name additional support for English notation in comparison operations (eq - equal, gt - greater, lt - less, ge - greater or equal, le - less than or equal to) and binary operators (and, or, xor, not), as well as support for substrings.
Fetching substrings in fields is similar to extracting random bytes from a packet in Pcap filters, but has a more flexible syntax. For example, such an expression would check the first 4 bytes of the source MAC address field of an Ethernet frame (equivalent to):
Eth.src[:4] == 00:1d:72:01
Of course, the difference between filters is that Pcap rules are used when intercepting traffic; in the graphical interface they are configured in the “Capture options” dialog box (by the way, it is possible to remember frequently used expressions). And display filters work with packages located in the list of the main program window:

Functionally, Wireshark's built-in filtering subsystem is much more user-friendly. In particular, there is no need to remember message format details (offsets, margin sizes, etc.). The required message field of this protocol can be easily found in the window for setting up display rules (Filter Expression), and you can also select a condition and a predefined value from the list for this field or specify your own. For any of the many protocols supported by Wireshark, you can configure a display filter in this simple way.
A very illustrative example would be the almost academic example of determining when a TCP segment buffer overflows using the following mapping rule:
Tcp.window_size == 0 && tcp.flags.reset != 1
Conclusion
The Wireshark protocol analyzer has a powerful packet filtering system and makes it possible to create complex rules using logical functions and binary operators. The capture time filters are standard and will be familiar to users who have used Pcap-based network utilities such as tcpdump. The rules for displaying packages are easy to learn and use, thanks to the graphical interface capabilities of the program in question. Overall, the functionality of Wireshark's filtering system allows you to take advantage of the low-level packet filter quite effectively.
Introduction
When studying network interactions at the level of individual packets, datagrams, segments, and application-level messages, it is often necessary to solve traffic filtering problems. The essence of using filters is to search and select groups, as well as individual transmission units that are of interest for further analysis. This functionality is extremely useful in tools designed to intercept and study network traffic (sniffers), and helps a system administrator or information security specialist find a bit of useful information in the intensive information flows of modern networks.
The open multi-platform filter discussed in this article includes two filter subsystems: traffic interception time (capture filters) and display filters. As you know, the first subsystem is based on the rules language of the Pcap (Packet Capture) library. “Scrubbing” traffic during collection, in particular, reduces the number of packets intercepted, thereby saving space in memory or on the hard drive. As for display filters, they, being a built-in function of Wireshark, are designed to “customize” already intercepted traffic in the program’s graphical interface.
About filter languages
The ability to intercept traffic for monitoring and debugging purposes is present in the network stack of any operating system. It is carried out using the so-called Packet Filter, which is part of the system kernel and receives received/sent packets from the network card driver. The most famous packet filters for Unix-like operating systems are BPF (Berkeley Packet Filter) and LSF (Linux Socket Filter).
Thus, traffic sampling according to specified criteria in BPF implemented in the form of a special case-sensitive primitive machine language, for which the packet filter itself acts as an interpreter. Programs in this language can extract fragments from packets, compare the received data with specified values, test individual bits, perform arithmetic operations, and then accept or discard packets depending on the results of all these tests. The "low-level" approach is useful for programmers developing network function libraries and various utilities.
Ordinary users usually use "high-level" filter languages. A typical application language used in a sniffer to describe traffic rules allows the construction of expression primitives based on individual message fields of various protocols. In this case, the criterion can be the ratio of the field value to a certain value (equal to, greater than, less than), the coincidence of the value with the template, or simply the presence of the field in the message. Primitives can be combined into a complex expression using logical functions (“and”, “or”, “not”, etc.).
In the open source world, the de facto standard filter language is the syntax used in the Pcap library. It is the basis not only for Wireshark, but also for other open source utilities, such as, for example, the well-known console sniffer tcpdump in the Unix world. Actually, Pcap and tcpdump are a joint project. The popular intrusion detection system Snort also uses the Pcap format in packet capture mode to define traffic filtering rules.
Pcap Filter Basics
So, filter includes one or more primitives. A primitive usually consists of an object (number or name) and one or more specifiers specifying the protocol (ether, fddi, tr, wlan, ip, ip6, arp, rarp, decnet, tcp, udp), direction (src, dst, any and etc.) and object type (host, net, port, etc.). For example, to intercept packets in which the outgoing IP address is 192.168.56.102, you should use a filter like:
IP src host 192.168.56.102
Or to record ARP traffic involving hosts on the 192.168.56.0 network:
Arp net 192.168.56
Frequently used specifiers are summarized in a table (optional components are designated - , alternatives - |, objects -< >). A complete list can be found in the Pcap documentation (on Linux, available in the user manual using the man pcap-filter command).
In order to combine several primitives into one expression, logical functions are used: “and” (denoted by the keyword and or &&), “or” (or or ||), “not” (not or!). For example, to intercept SSH protocol traffic for node 192.168.56.102, the following design is suitable:
Tcp port 22 and host 192.168.56.102
For very complex expressions, parentheses should be used. For example:
Net 192.168.56.0/24 and (tcp port 21 or tcp port 22)
Pcap filters without restrictions
For those who are used to living by their own rules, the Pcap library provides random access to the contents of network packets, using the full power of the OS packet filter. This is done using a fairly simple syntax:
Proto[exp:size]
where, the proto parameter is one of the protocols supported by Wireshark; exp is the offset in bytes relative to the beginning of the layer specified in proto, and size is the number of bytes to extract.
Considering that in primitives it is possible to apply comparison operations in the notation of the C programming language (>, =,
The example, however, has only a methodological meaning, since this protocol is easily filtered by the standard icmp rule.
But selecting HTTP requests made using the GET method on the fly from traffic is not such an easy task for Pcap. And the solution proposed in the documentation claims to be original:
Port 80 and tcp[((tcp & 0xf0) >> 2):4] = 0x47455420
This filter checks for the presence of the "G", "E", "T" and "" bytes (hex values 47, 45, 54 and 20) immediately after the TCP header, the length of which is calculated by the expression "tcp & 0xf0) >> 2".
As can be seen from the last example, in addition to comparison operations, binary C operators (+, -, *, /, &, |, >) are also available to the user directly in the primitives.
About display filters
Speaking of differences display filters from Pcap filters, then in addition to the format for recording specifiers (protocol fields look like..., for example ip.len), you can also name additional support for English notation in comparison operations (eq - equal, gt - greater, lt - less, ge - greater or equal, le - less than or equal to) and binary operators (and, or, xor, not), as well as support for substrings.
Fetching substrings in fields is similar to extracting random bytes from a packet in Pcap filters, but has a more flexible syntax. For example, such an expression would check the first 4 bytes of the source MAC address field of an Ethernet frame (equivalent to):
Eth.src[:4] == 00:1d:72:01
Of course, the difference between filters is that Pcap rules are used when intercepting traffic; in the graphical interface they are configured in the “Capture options” dialog box (by the way, it is possible to remember frequently used expressions). And display filters work with packages located in the list of the main program window:
Functionally, Wireshark's built-in filtering subsystem is much more user-friendly. In particular, there is no need to remember message format details (offsets, margin sizes, etc.). The required message field of this protocol can be easily found in the window for setting up display rules (Filter Expression), and you can also select a condition and a predefined value from the list for this field or specify your own. For any of the many protocols supported by Wireshark, you can configure a display filter in this simple way.
A very illustrative example would be the almost academic example of determining when a TCP segment buffer overflows using the following mapping rule:
Tcp.window_size == 0 && tcp.flags.reset != 1
Conclusion
The Wireshark protocol analyzer has a powerful packet filtering system and makes it possible to create complex rules using logical functions and binary operators. The capture time filters are standard and will be familiar to users who have used Pcap-based network utilities such as tcpdump. The rules for displaying packages are easy to learn and use, thanks to the graphical interface capabilities of the program in question. Overall, the functionality of Wireshark's filtering system allows you to take advantage of the low-level packet filter quite effectively.
Introduction
Problems sometimes arise in the operation of a computer network and the network stack of nodes, the causes of which are difficult to detect by well-known statistics collection utilities (such as netstat) and standard applications based on the ICMP protocol (ping, traceroute/tracert, etc.). In such cases, to diagnose problems, it is often necessary to use more specific tools that allow you to display (listen to) network traffic and analyze it at the level of transmission units of individual protocols ( "sniffing", sniffing).
Network Protocol Analyzers or "sniffers" are extremely useful tools for studying the behavior of network nodes and identifying network problems. Of course, like any tool, such as a sharp knife, a sniffer can be both a boon in the hands of a system administrator or information security engineer, and a weapon of crime in the hands of a computer attacker.
Such specialized software usually uses “promiscuous” (promiscuos) mode of operation of the network adapter monitor computer (in particular, to intercept traffic from a network segment, switch port or router). As you know, the essence of this mode is to processing all frames coming to the interface, and not just those destined for the MAC address of the network card and broadcast, as happens in normal mode.
The product discussed in this article Wireshark is a well-known tool for intercepting and interactively analyzing network traffic, in fact, a standard in industry and education. TO Key features of Wireshark may include: multi-platform (Windows, Linux, Mac OS, FreeBSD, Solaris, etc.); ability to analyze hundreds of different protocols; support for both graphical operating mode and command line interface (tshark utility); powerful traffic filter system; exporting work results to XML, PostScript, CSV formats, etc.
Another important fact is that Wireshark is open source software. distributed under the GNU GPLv2 license, i.e. You are free to use this product as you wish.
Installing Wireshark
The latest version of Wireshark for Windows and OS X operating systems, as well as the source code, is available download from the project website. For Linux distributions and BSD systems, this product is usually available in standard or additional repositories. The screenshots published in this article were taken from version 1.6.2 of Wireshark for Windows. Earlier versions of the program, which can be found in the repositories of Unix-like operating systems, can also be successfully used, since Wireshark has long been a stable and functional product.
Wireshark is based on the Pcap (Packet Capture) library, which provides an application programming interface for implementing low-level functions of interaction with network interfaces (in particular, interception and generation of arbitrary transmission units of network protocols and local network protocols). The Pcap library is also the basis of such well-known networking tools as tcpdump, snort, nmap, kismet, etc. For Unix-like systems, Pcap is usually present in standard software repositories. For the Windows family of operating systems, there is a version of Pcap called Winpcap. You can download from the project website. However, this is usually not necessary, since the Winpcap library is included in the Wireshark for Windows installation package.
The process of installing the program is not difficult for any operating system, adjusted, of course, for the specifics of the platform you are using. For example, Wireshark on Debian/Ubuntu is installed so that unprivileged users by default do not have the right to intercept packets, so the program must be launched using the sudo user ID mechanism (or perform the necessary manipulations according to the documentation of the standard DEB package).
Basics of working with Wireshark
Wireshark's user interface is built on top of the GTK+ library(GIMP Toolkit). The main program window includes the following elements: menu, toolbars and viewing filters, a list of packages, a detailed description of the selected package, display of package bytes (in hexadecimal and text) and a status bar:
It should be noted that the user interface of the program is well designed, quite ergonomic and quite intuitive, which allows the user to concentrate on studying network processes without being distracted by trifles. In addition, all the features and details of using Wireshark are described in detail in user manual. Therefore, this article focuses on the functionality of the product in question, its features in comparison with other sniffers, for example, with the well-known console utility tcpdump.
So, Wireshark's ergonomics reflect a multi-layered approach to providing network interactions. Everything is done in such a way that, by selecting a network packet from the list, the user has the opportunity to view all the headers (layers), as well as the field values of each layer of the network packet, starting from the wrapper - the Ethernet frame, the IP header itself, the transport layer header and application data protocol contained in the package.
The raw data for processing can be obtained by Wireshark in real time or imported from a network traffic dump file, and multiple dumps for analysis tasks can be combined into one on the fly.
The problem of finding the necessary packets in large volumes of intercepted traffic is solved two types of filters: traffic collection (capture filters) and him display filters. Wireshark collection filters are based on the Pcap library filter language, i.e. The syntax in this case is similar to the syntax of the tcpdump utility. A filter is a series of primitives combined, if necessary, with logical functions (and, or, not). Frequently used filters can be saved in profile for reuse.
The figure shows the profile of Wireshark collection filters:

Wireshark network packet analyzer also has its own simple but feature-rich display filter language. The value of each field in the packet header can be used as filtering criteria(for example, ip.src is the source IP address in the network packet, frame.len is the length of the Ethernet frame, etc.). Using comparison operations, field values can be compared to specified values(for example, frame.len and combine several expressions with logical operators (for example: ip.src==10.0.0.5 and tcp.flags.fin). A good helper in the process of constructing expressions is window for setting up display rules (Filter Expression):

Network packet analysis tools
While connectionless protocols can be studied by simply looking at individual packets and calculating statistics, studying the operation of connection-oriented protocols is greatly simplified by the availability of additional capabilities for analyzing the progress of network interactions.
One of the useful features of Wireshark is the "Follow TCP Stream"(literally, “Follow TCP stream”) analysis submenu “Analyze”, which allows you to extract application protocol data from the TCP segments of the stream to which the selected packet belongs:

Another interesting item in the analysis submenu is "Expert Info Composite", which opens a window of the built-in Wireshark expert system, which will try to detect errors and comments in packets, automatically select individual connections from the dump and characterize them. This module is under development and is being improved from version to version of the program.
In the statistics submenu "Statistics" options have been collected that allow you to calculate all kinds of statistical characteristics of the traffic being studied, build graphs of the intensity of network flows, analyze the response time of services, etc. Yes, point "Protocol Hierarchy" displays statistics in the form of a hierarchical list of protocols indicating the percentage of total traffic, the number of packets and bytes transmitted by a given protocol.
Function "Endpoint" provides multi-level statistics on incoming/outgoing traffic of each node. Paragraph "Conversations"(literally, “conversations”) allows you to determine the volumes of traffic of various protocols (link, network and transport layers of the open systems interconnection model) transmitted between nodes interacting with each other. Function "Packet Lengths" displays the distribution of packets by their length.
Paragraph "Flow Graph..." represents packet flows graphically. In this case, when you select an element on the chart, the corresponding package in the list in the main program window becomes active:

A separate submenu in the latest versions of Wireshark is dedicated to IP telephony. In the “Tools” submenu there is an item "Firewall ACL Rules", will try to create a firewall rule for the selected package (version 1.6.x supports Cisco IOS, IP Filter, IPFirewall, Netfilter, Packet Filter and Windows Firewall formats).
The program also has a built-in lightweight interpreter Lua programming language. Using Lua, you can create your own protocol decoders and event handlers in Wireshark.
Instead of a conclusion
The Wireshark network packet analyzer is an example of an Opensource product that is successful both within the Unix/Linux platform and popular among Windows and Mac OS X users. Of course, in addition to Wireshark, there are heavyweight, comprehensive intelligent solutions in the field of network traffic research, the functionality of which is much wider. But, firstly, they cost a lot of money, and secondly, they are difficult to learn and operate; thirdly, you need to understand that not everything can be automated and no expert system can replace a good specialist. So, if you are faced with tasks that require analyzing network traffic, then Wireshark is the tool for you. And fans of the command line can use the utility tshark - console version of Wireshark.
Author: Riccardo Capecchi
Date published: March 22, 2011
Translation: A. Panin
Translation publication date: November 29, 2012
In this article, we will look at the process of using BPF filters in Wireshark to show details of the functioning of an HTTP session, an e-mail session, and also look at the process of monitoring visitors to a selected site from the local network. To conclude, I'll provide a list of particularly useful filter expressions to use in Wireshark.
In addition to the FTP example described in the previous part of the article, there is another classic example of using Wireshark - examining an HTTP session. As before, launch Wireshark and begin capturing traffic from the interface directed to the external network. Nowadays, most HTTP traffic is compressed to speed up the exchange of information, so by default Wireshark decompresses the payload of HTTP packets. You can select the menu items "Edit->Preferences->Protocols->HTTP" and make sure that the "Uncompress entity bodies" option is selected.
While capturing packets, set a filter to show only HTTP traffic by entering http as the filter expression. Every web page visited by any user on your network will generate the kind of traffic that you will capture - a large amount of information should be expected. Perhaps you are interested in a certain type of information or a specific user. To do this, in the main window, where all received packets are presented, select the http request and using the right mouse button select the menu item "Follow TCP Stream". Wireshark will open a new window containing a complete reconstruction of the HTTP session in chronological order.
You can also separate requests to a specific site, for example Facebook - in order to see which IP addresses the requests originated from, the expression in the filter field should be as follows: http.request.uri contains facebook .
Now let's say that you wanted to see all the incoming and outgoing traffic for one specific computer. You will need a MAC address filter to ensure that the correct client is being examined. To obtain the MAC address of the target system on the other end of the connection, you must ping the hostname or URL to obtain the system's IP address. After this, the arp command is used: ping target.com arp -a
In the list produced by the arp command, you need to find the IP address obtained as a result of the ping command. Once you have the MAC address, say "AA:BB:CC:DD:EE:FF" - enter the expression in the filter field: eth.addr == AA:BB:CC:DD:EE: FF
Alternatively, you can use IP address filtering, but on networks that use DHCP to assign IP addresses, the target system's IP address can change at any time: ip.addr == 192.168.0.1
Click "Apply" and you will only see incoming and outgoing traffic for the selected IP or MAC address. If you use the "ip" parameter, all traffic related to the Internet Protocol is displayed, which is suitable in 99% of network research cases.
Instead of the "ip.addr" filter parameter, you can use the "host" parameter as follows: host 192.168.0.1
After installing such a filter, Wireshark captures all traffic going to and from the host with the address 192.168.0.1, regardless of type.
Now let's imagine that you want to capture all the traffic for a node generated by applications using a given protocol, such as pop3, ftp, http or messenger. Enter the expression in the filter field: ip.addr == 192.168.0.1 and (http or ftp or messenger or pop)
This expression tells you to show only traffic originating from or directed to the host with IP address 192.168.0.1 and to show only packets related to the ftp, pop, or messenger protocols.
You can capture all such traffic transmitted on a network with a given address or from a group of clients: ip.addr == 192.168.0 and (http or ftp or messenger or pop)
The most commonly used filters for Wireshark
Among the filters we reviewed, we can highlight several of the most common ones. If you'd like a list of all the possible filters, check out the Wireshark official manual pages on capture and display filters.
- ip.addr == 192.168.0.1 - Display traffic transmitted relative to node 192.168.0.1 in both directions.
- tcp.port == 80 - Display all traffic with source or destination port 80.
- ip.src == 192.168.0.1 and ip.dst == 10.100.1.1 - Display all traffic generated by node 192.168.0.1 and directed to node 10.100.1.1
- ftp - Display traffic related to the FTP protocol
- http - Display traffic related to the HTTP protocol
- dns - Display traffic related to the DNS protocol
- http.request.uri contains string - Display HTTP traffic when the URL contains the string "string".
BPF filter technology makes Wireshark a powerful and flexible tool, but this article only scratches the surface of what you can do with it. It would take another article or even several to describe things like how you can use Wireshark to test the possibility of denial of service attacks on your network or analyze the quality of communication for a SIP-based VOIP system.